MySQL Datenbank-Optimierung
Es gibt verschiedene Ansätze eine MySQL-Datenbank hinsichtlich ihrer Performance zu analysieren und zu optimieren. Zwei davon möchten wir Ihnen vorstellen. Interessant ist dies einerseits wenn ein System zu langsam läuft und man Produktivitätseinbußen hat. Andererseits sollte man aber auch das bestmögliche aus den gegebenen Resourcen herausholen. Ein System hinsichtlich I/O und RAM-Auslastung unnötig zu "schonen" ist auch nicht zielführend.
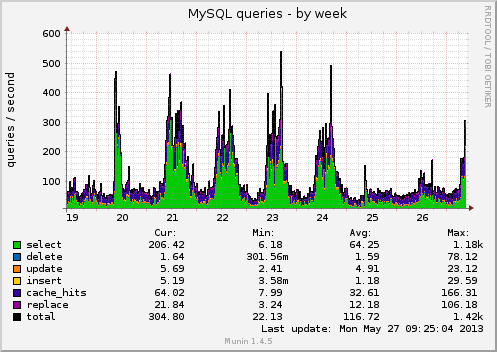
Ein Schritt zur Analyse ist eine permanente Auswertung auf z.B. "cacti" oder "munin" Basis laufen zu lassen. Hier ein Beispielscreenshot eines unserer Systeme mittels "munin".
Da es nicht immer einfach ist, die knapp 300 Werte manuell auszuwerten, die der SQL-Befehl SHOW STATUS;
zurückgibt, stellen wir zwei Tools vor die diese Informationen aufbereiten und konkrete Tipps geben:
- mysqltuner.pl
- tuning-primer.sh
Bei beiden Tools sei vorab gesagt, daß das Ausführen nur Sinn macht, wenn die Datenbank wenigstens ca. 48h produktiv lief, nach z.B. einem Neustart. Um so länger, um so besser!
MySQL-Tuner erhalten sie ganz einfach auf diesem Wege:
$ wget http://mysqltuner.pl
Beispielausgabe:
>> MySQLTuner 1.2.0 - Major Hayden
>> Bug reports, feature requests, and downloads at http://mysqltuner.com/
>> Run with '--help' for additional options and output filtering
[OK] Logged in using credentials from debian maintenance account.-------- General Statistics --------------------------------------------------
[--] Skipped version check for MySQLTuner script
[OK] Currently running supported MySQL version 5.1.66-0+squeeze1
[OK] Operating on 64-bit architecture-------- Storage Engine Statistics -------------------------------------------
[--] Status: +Archive -BDB -Federated +InnoDB -ISAM -NDBCluster
[--] Data in MyISAM tables: 2G (Tables: 17493)
[--] Data in InnoDB tables: 353M (Tables: 2289)
[--] Data in MEMORY tables: 2M (Tables: 41)
[!!] Total fragmented tables: 2322-------- Security Recommendations -------------------------------------------
[!!] User '@%' has no password set.
[!!] User '@localhost' has no password set.
[!!] User '@router' has no password set.-------- Performance Metrics -------------------------------------------------
[--] Up for: 3d 13h 30m 56s (177M q [575.741 qps], 359K conn, TX: 27B, RX: 23B)
[--] Reads / Writes: 3% / 97%
[--] Total buffers: 282.0M global + 2.7M per thread (100 max threads)
[OK] Maximum possible memory usage: 550.7M (6% of installed RAM)
[OK] Slow queries: 0% (69/177M)
[OK] Highest usage of available connections: 30% (30/100)
[!!] Key buffer size / total MyISAM indexes: 8.0M/1.0G
[!!] Key buffer hit rate: 93.2% (4B cached / 274M reads)
[OK] Query cache efficiency: 53.1% (6M cached / 11M selects)
[!!] Query cache prunes per day: 42316
[OK] Sorts requiring temporary tables: 6% (4K temp sorts / 69K sorts)
[!!] Joins performed without indexes: 2349
[!!] Temporary tables created on disk: 32% (196K on disk / 597K total)
[OK] Thread cache hit rate: 99% (30 created / 359K connections)
[!!] Table cache hit rate: 0% (1K open / 41M opened)
[OK] Open file limit used: 84% (1K/2K)
[OK] Table locks acquired immediately: 99% (168M immediate / 168M locks)
[!!] InnoDB data size / buffer pool: 354.0M/128.0M-------- Recommendations -----------------------------------------------------
General recommendations:
Run OPTIMIZE TABLE to defragment tables for better performance
Enable the slow query log to troubleshoot bad queries
Adjust your join queries to always utilize indexes
When making adjustments, make tmp_table_size/max_heap_table_size equal
Reduce your SELECT DISTINCT queries without LIMIT clauses
Increase table_cache gradually to avoid file descriptor limits
Variables to adjust:
key_buffer_size (> 1.0G)
query_cache_size (> 128M)
join_buffer_size (> 128.0K, or always use indexes with joins)
tmp_table_size (> 16M)
max_heap_table_size (> 16M)
table_cache (> 1024)
innodb_buffer_pool_size (>= 353M)
Hier gibt uns das Tool gleich mehrere wertvolle Hinweise:
- offensichtlich gibt es drei etwas kryptisch anmutende Benutzernamen die passwortlos sind. Das sind noch Überbleibsel einer alten DB-Migration -> Entfernen!
- Gemäß der Kombination an Schaltern die in der my.cnf gesetzt sind, ist der zur Verfügung stehende RAM mit "nur" 6% möglichen Prozent ausgelastet. Ob das viel oder wenig ist, muß der Administrator selbst entscheiden. Auf einem für diese Datenbank dedizierten System wäre das eher wenig.
- Gleichzeitig weist das Programm aber auch auf mögliche Verbesserungen in der Programmierung der Abfragen hin ("reduce select distinct", "always utilize indexes")
- uvm.
Mit dem Programm tuning-primer.sh auf die gleiche Datenbank angewendet (nur Minuten später), sieht das Ergebnis so aus:
$ wget http://www.day32.com/MySQL/tuning-primer.sh
$ bash tuning-primer.sh
-- MYSQL PERFORMANCE TUNING PRIMER --
- By: Matthew Montgomery -MySQL Version 5.1.66-0+squeeze1 x86_64
Uptime = 3 days 13 hrs 37 min 44 sec
Avg. qps = 575
Total Questions = 177332046
Threads Connected = 12Server has been running for over 48hrs.
It should be safe to follow these recommendations
[...]SLOW QUERIES
The slow query log is NOT enabled.
Current long_query_time = 10.000000 sec.
You have 69 out of 177332067 that take longer than 10.000000 sec. to complete
Your long_query_time seems to be fineBINARY UPDATE LOG
The binary update log is NOT enabled.
You will not be able to do point in time recovery
See http://dev.mysql.com/doc/refman/5.1/en/point-in-time-recovery.htmlWORKER THREADS
Current thread_cache_size = 32
Current threads_cached = 17
Current threads_per_sec = 0
Historic threads_per_sec = 0
Your thread_cache_size is fineMAX CONNECTIONS
Current max_connections = 100
Current threads_connected = 13
Historic max_used_connections = 30
The number of used connections is 30% of the configured maximum.
Your max_connections variable seems to be fine.INNODB STATUS
Current InnoDB index space = 172 M
Current InnoDB data space = 353 M
Current InnoDB buffer pool free = 0 %
Current innodb_buffer_pool_size = 128 M
Depending on how much space your innodb indexes take up it may be safe
to increase this value to up to 2 / 3 of total system memoryMEMORY USAGE
Max Memory Ever Allocated : 346 M
Configured Max Per-thread Buffers : 268 M
Configured Max Global Buffers : 265 M
Configured Max Memory Limit : 534 M
Physical Memory : 7.74 G
Max memory limit seem to be within acceptable normsKEY BUFFER
Current MyISAM index space = 1.04 G
Current key_buffer_size = 7 M
Key cache miss rate is 1 : 14
Key buffer free ratio = 81 %
Your key_buffer_size seems to be fineQUERY CACHE
Query cache is enabled
Current query_cache_size = 128 M
Current query_cache_used = 82 M
Current query_cache_limit = 16 M
Current Query cache Memory fill ratio = 64.26 %
Current query_cache_min_res_unit = 4 K
MySQL won't cache query results that are larger than query_cache_limit in sizeSORT OPERATIONS
Current sort_buffer_size = 2 M
Current read_rnd_buffer_size = 256 K
Sort buffer seems to be fineJOINS
Current join_buffer_size = 132.00 K
You have had 2353 queries where a join could not use an index properly
You should enable "log-queries-not-using-indexes"
Then look for non indexed joins in the slow query log.
If you are unable to optimize your queries you may want to increase your
join_buffer_size to accommodate larger joins in one pass.Note! This script will still suggest raising the join_buffer_size when
ANY joins not using indexes are found.OPEN FILES LIMIT
Current open_files_limit = 2158 files
The open_files_limit should typically be set to at least 2x-3x
that of table_cache if you have heavy MyISAM usage.
You currently have open more than 75% of your open_files_limit
You should set a higher value for open_files_limit in my.cnfTABLE CACHE
Current table_open_cache = 1024 tables
Current table_definition_cache = 256 tables
You have a total of 19846 tables
You have 1024 open tables.
Current table_cache hit rate is 0%
, while 100% of your table cache is in use
You should probably increase your table_cache
You should probably increase your table_definition_cache value.TEMP TABLES
Current max_heap_table_size = 16 M
Current tmp_table_size = 16 M
Of 400784 temp tables, 32% were created on disk
Perhaps you should increase your tmp_table_size and/or max_heap_table_size
to reduce the number of disk-based temporary tables
Note! BLOB and TEXT columns are not allow in memory tables.
If you are using these columns raising these values might not impact your
ratio of on disk temp tables.TABLE SCANS
Current read_buffer_size = 128 K
Current table scan ratio = 150 : 1
read_buffer_size seems to be fineTABLE LOCKING
Current Lock Wait ratio = 1 : 58223
Your table locking seems to be fine
Auch diese Werte bedürfen natürlich wieder einer individuellen Interpretation.
Sollten Sie Unterstützung bei der Optimierung Ihrer Datenbank / Servers benötigen, melden Sie sich einfach bei uns!